
Page 13 - IDEA Study 2 2017 Predatory journals in Scopus
P. 13
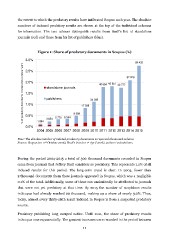
the extent to which the predatory results have infiltrated Scopus each year. The absolute
numbers of indexed predatory results are shown at the top of the individual columns
for information. The two colours distinguish results from Beall's list of standalone
journals (red) and those from his list of publishers (blue).

                                                            Figure 1: Share of predatory documents in Scopus (%)

                                                      3.0%                                                                                59 433

% of predatory documents in total citable dobcumetns  2.5%                                                                        52 026
                                                      2.0%                                         40 654 42 857 42 777
                                                      1.5%
                                                      1.0%  standalone journals

                                                            publishers                     24 026
                                                                                 17 026

                                                      0.5%                                           9 399
                                                      0.0%            3 854 5 770 6 544
                                                            1 894

                                                            2004 2005 2006 2007 2008 2009 2010 2011 2012 2013 2014 2015

Note: The absolute number of indexed predatory documents is reported above each column.
Source: Scopus (on 11th October 2016), Beall's lists (on 1st April 2016), authors' calculations.

During the period 2004-2015 a total of 306 thousand documents recorded in Scopus
came from journals that Jeffrey Beall considers as predatory. This represents 1.2% of all
indexed results for this period. The long-term trend is clear. In 2004, fewer than
2 thousand documents from these journals appeared in Scopus, which was a negligible
0.1% of the total. Additionally, some of these can undoubtedly be attributed to journals
that were not yet predatory at that time. By 2015 the number of suspicious results
in Scopus had already reached 60 thousand, making up a share of nearly 3.0%. Thus,
today, almost every thirty-sixth result indexed in Scopus is from a suspected predatory
source.

Predatory publishing long escaped notice. Until 2011, the share of predatory results
in Scopus rose exponentially. The greatest increases were recorded in the period between

                                                          11